It is not about the number of GHz. It is about the power you feel.
Before the introduction of the M1 chip, I was extremely curious about how Apple will communicate such a complex, technical topic to a wide audience – the majority of people are not engineers.
Here are the conclusions after the keynote. We all should learn from Apple’s Team how to communicate difficult topics to people. I think they have done stunning work.
Now, grab the mug of your favorite coffee, and let’s reveal the secrets of a successful tech presentation!
Glanceable Charts
Charts are normally created to present detailed information—lots of points, lines, and numbers. However, you will not find them in Apple’s Keynote charts.
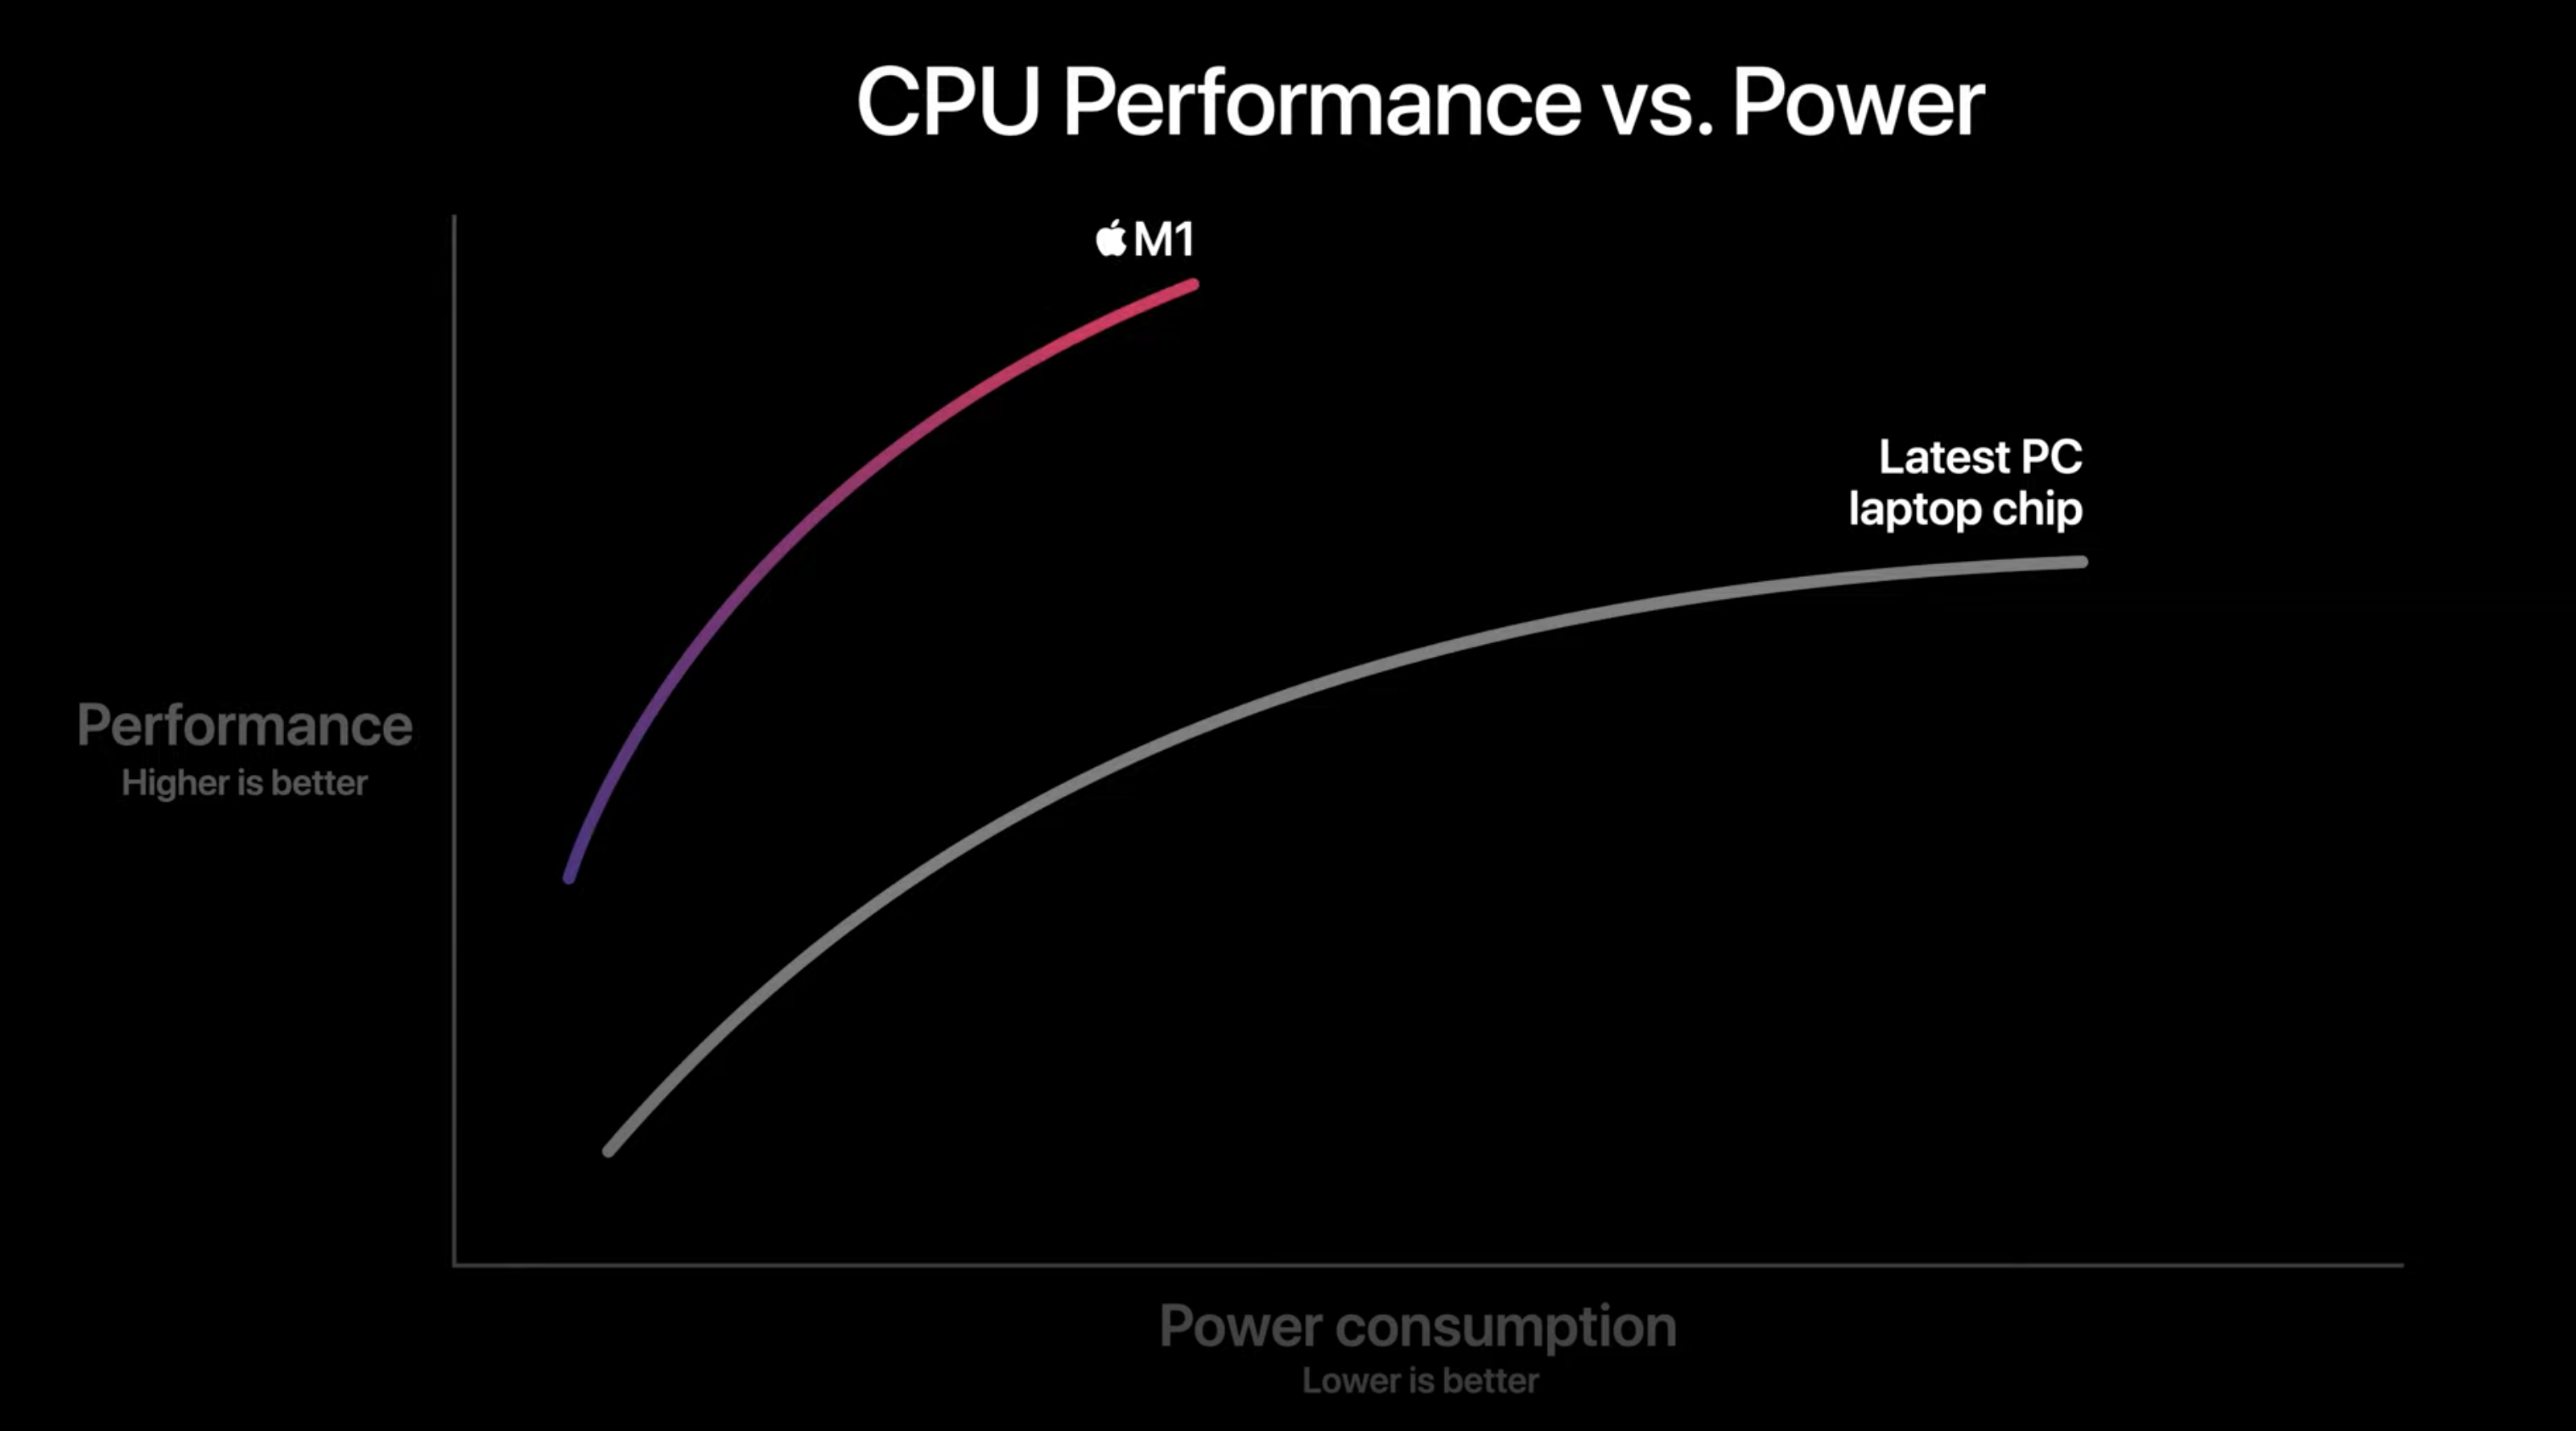
The chart does not have numbers or scales on the X & Y-axis. They would not mean anything to the majority of the keynote viewers. They have just labels – “Performance” and “Power Consumption.”
What’s more, Apple has also added an additional note to each position – “Performance – Higher is better,” “Power Consumption – Lower is better.” Thanks to this, everyone is able to see and compare the presented results.
What’s more, it is worth mentioning that the gradients used to visualize M1 Chip are also used to present it on a chart. This automatically binds the result with the analyzed object and creates a feeling of consistency – delightful! I am sure that everyone would intuitively know which line presented the Performance of the M1 CPU.
The final result is a clear and meaningful chart where you can compare new Apple’s CPU with others.
Technology Advancement
While the chip itself does not look very attractive, Apple made everything to make it look extremely modern. They added a glow effect with a gradient to create a foundation for the visual brand of this piece of technology.
M1 Chip was also animated in a way that shows that it is a future technology. You surely noticed that Star Wars and Star Trek movies inspired the motion that presents MacBook Pro’s assemble process.

Impress with the Numbers
Apple makes everything to show as little as possible numbers at once. They want you to understand the difference, to visualize the speed of the new chip. On the other hand, they also know that big numbers make a huge impression.
That is why they added additional bullet points when presenting the structure of the M1 chip. Every point reveals the number that feels tremendous in the eyes of non-technical people but also has meaning for engineers.
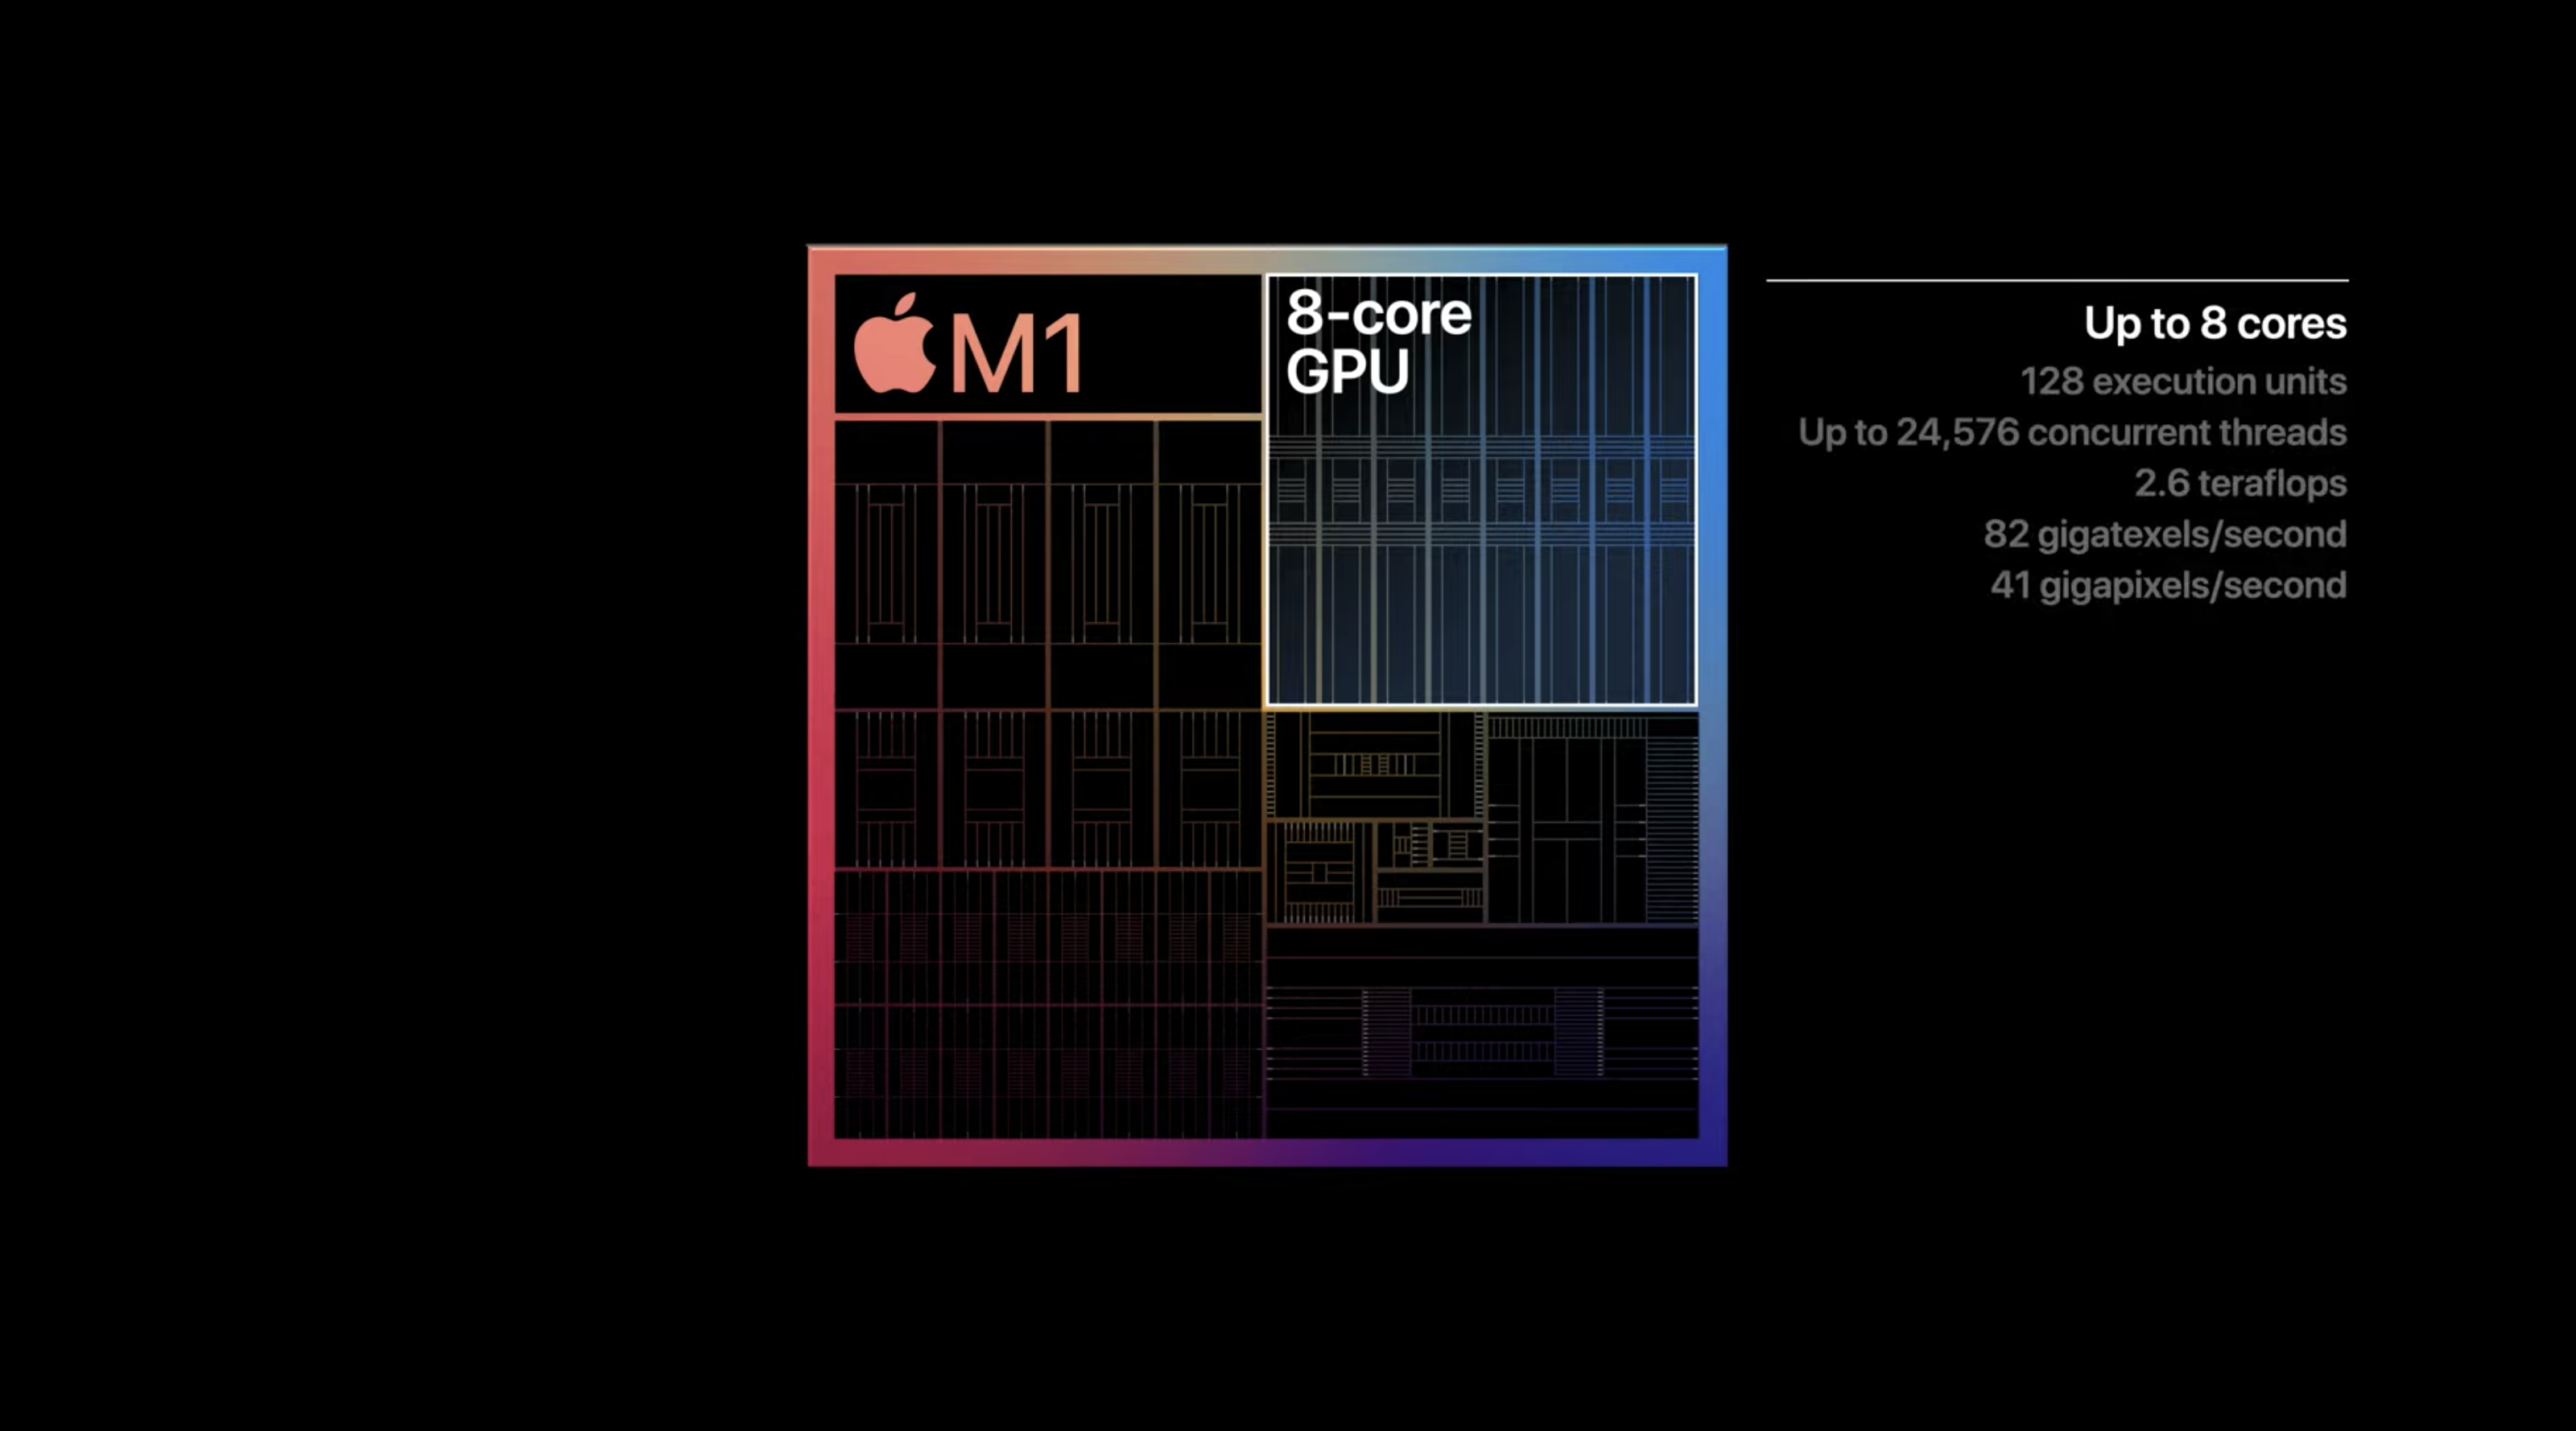
This high density of information is not frequent during the presentation. Apple had to show it to demonstrate the advancement of the created technology, but they also do not speak all the time about that. The whole technical part was very condensed and did not overwhelm people.
Compare Things to Show the Meaning
Many times during the presentation, we heard that M1 chips are X times better/faster/powerful than others. Why did Apple not use specific numbers? Here is a brief explanation:

When you hear that MacBook Air is 3 times that best-selling Windows laptop in its class, you automatically know that it should be much better than other devices in the category, you do not have to compare the models of CPUs, number of Cores, or their GHz. One sentence explains everything.
We also heard that Machine Learning has 9 times better performance. But what term Machine Learning means to most people? Nothing! That is why, after a few seconds, we get the true meaning of the improvement: You will be able to make your videos much faster in the apps like Final Cut Pro.
Now you know what the improved chip means to you!
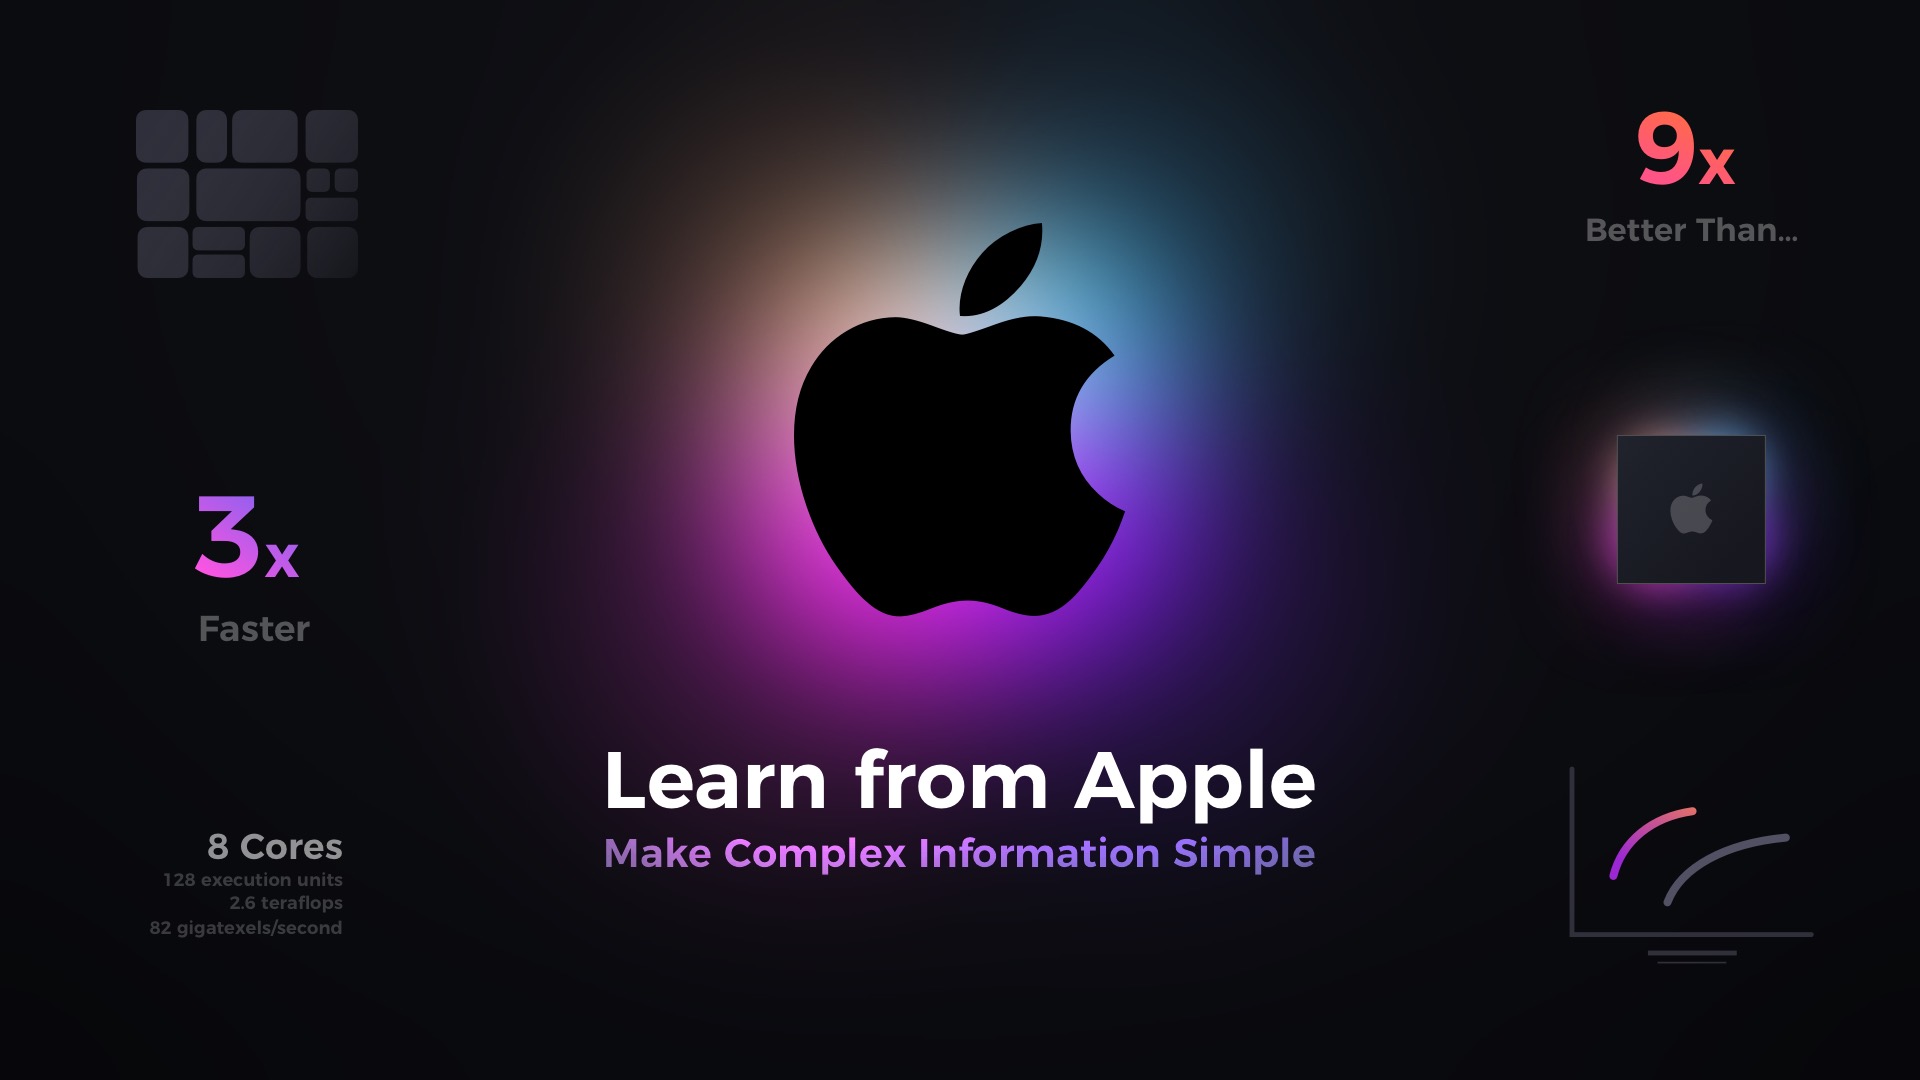
Beautiful Summary Slides
It is hard to remember everything, all improvements, and features. That is why Apple builds an excellent summary to remind and impress you again.

Every slide of this category contains product visualization in the center. And multiple blocks around to show how the tiny pieces create a final holistic & delightful solution.
Folks at Apple know that simple numbers always stay in our minds. This is why we can notice again that the specific device has got 5x faster graphics, and it is 9x times more efficient.
Conclusion
Here are the lessons you may learn from Apple:
- If you are speaking to people not familiar with the topic, use comparisons.
- Simplify numbers and charts, and show which results are better.
- You do not have to be extra precise. You have to be meaningful.
- Summarize each section of the presentation and keep it clear & concise.
This was the key to Apple’s presentation success. Did you notice something else? Let me know! I hope you found the article useful.
By the way…
If you start a new project or would like to organize your UI Library in Figma — do not waste your time creating everything from scratch. Feel free to use the Prime — Design System Kit. It helps you design UI with the best Figma techniques — Component Properties, Variants, Auto Layout and more.See Prime in action.
To make it easier there is a gift 🎁 - Use UXMISFIT10 offer code to get 10% Off.

You can also Create User Flows faster in Figma & Sketch — With SQUID you can create User Flows directly in your favorite design tool. You may style them to your project brand within a couple of clicks. Prepare all kind of diagrams in minutes. See how it works.
All images from the article from Apple.com